 KnowThis
Key Takeaways
Key Takeaways
- 1World population passed 8 billion people in November 2022, according to United Nations estimates — up from 1 billion around 1804, a milestone humanity took its entire prior history to reach.
- 2The global growth rate peaked at roughly 2.1% per year in the late 1960s and has been declining steadily since — it's now below 1% per year, even though the total number of people keeps rising because a smaller rate is applied to a much larger base.
- 3The UN's central projection has world population peaking around the mid-2080s at roughly 10.3 billion, then gradually declining, driven mainly by falling fertility rates worldwide.
The concept
That gap between "the growth rate is slowing" and "the total number is still rising" is the single most misunderstood fact about world population — and it only becomes concrete once you run the actual numbers.
World population keeps hitting new record highs every year. Does this mean population growth is accelerating?
Worked examples
Example 1: Projecting population forward with a steady growth rate (baseline case)
Example 2: Why a simple constant growth rate eventually breaks down (edge case / variation)
If you compound today's roughly 0.9% global growth rate forward for 200 years without adjustment, you get an unrealistically enormous population. Why don't demographers expect this to actually happen?
Example 3: India overtaking China as the world's most populous country (real-world / applied case)
For decades, China held the title of most populous country on Earth. According to UN estimates, India overtook China in 2023, with both nations' populations exceeding 1.4 billion. The shift reflects genuinely different fertility trajectories: India's fertility rate, while it has also fallen substantially over recent decades, has stayed somewhat higher than China's, while China's fertility rate dropped sharply — accelerated in part by its former one-child policy (in effect from 1980 to 2015) — and China's total population has since begun shrinking. This real-world example shows how national-level fertility differences, playing out over decades, directly reshape which countries lead global population rankings.
How it works (visual)
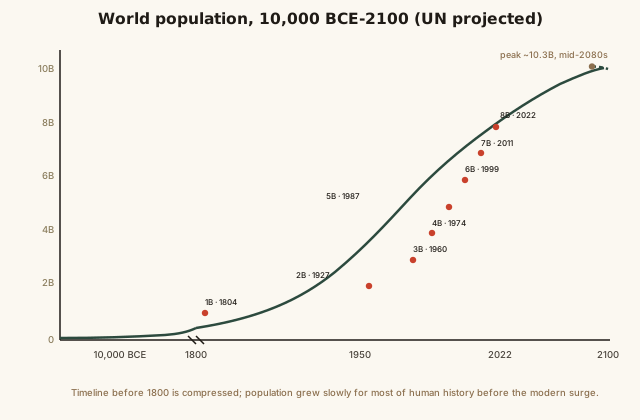
Notice how flat the line stays for most of human history, then bends sharply upward starting in the 1800s — and how the gaps between billion-milestones shrink dramatically at first (123 years between 1 and 2 billion, but just 11 years between 7 and 8 billion) before the curve's slope starts easing off again toward the projected peak on the right side of the graph.
Common mistakes
Common Mistakes
Assuming the world's population growth rate is currently at or near its historical peak.
→ The peak growth rate (about 2.1% per year) was back in 1968. The current rate is below 1% per year and has been declining for over five decades, even as the total population keeps rising.
Treating a population projection (like 'population will reach 10.3 billion') as a guaranteed fact rather than a model-based estimate.
→ Projections are built on assumptions about future fertility, mortality, and migration trends — they get revised as new data comes in, and real outcomes can diverge from any single projection.
Assuming every country's population is growing at the same pace, or all growing at all.
→ Growth varies enormously by country and region — some nations (including China, as of recent UN data) already have shrinking populations, while others, especially in parts of Sub-Saharan Africa, are still growing rapidly.
Common misconception
“World population is growing faster than ever before in history.”
The opposite is true of the growth rate. Global population growth peaked at roughly 2.1% per year around 1968 and has been declining fairly steadily since, currently sitting below 1% per year according to UN estimates. What has stayed large for a long stretch is the raw number of people added annually, because even a shrinking percentage rate applied to a much bigger base population can still translate into tens of millions of additional people each year. As fertility rates continue falling worldwide, the UN's central projection has that annual number continuing to shrink too, with total world population expected to peak around the mid-2080s before gradually declining.
A news headline says 'World population added more people this decade than any decade in history.' Does this contradict the fact that the growth rate has been falling since 1968?
Try it yourself
What to do next
What to do next
- Try the calculator above with a lower growth rate, like 0.5%, and a longer horizon, like 50 years, to see how sensitive long-run projections are to small rate changes.
- Next time you read a population headline, check whether it's describing the growth rate or the raw number of people added — they tell very different stories.
- Look up the UN World Population Prospects dashboard to see how a specific country's fertility rate and projected population compare to the global trend.
- Read the related entry on Urbanization Trends to see where all these additional people are actually settling.