 KnowThis
Key Takeaways
Key Takeaways
- 1Mean, median, and mode are three separate ways of describing a dataset's 'typical' value — and for the same dataset, they can give meaningfully different numbers.
- 2The mean is pulled toward outliers, because every value in the set counts in the sum; the median mostly ignores outlier magnitude, since it only cares about which value sits in the middle position after sorting.
- 3Mode is the only one of the three that works on non-numeric (categorical) data, like favorite colors or shoe brands, because it just counts how often each value appears rather than doing arithmetic on the values themselves.
The concept
What is the mean of the dataset 10, 20, 30?
Worked examples
Example 1: Five test scores (baseline case)
Example 2: Five salaries with one large outlier (edge case / variation)
Six students score 55, 60, 75, 80, 85, and 95 on a test. What is the median score?
Example 3: Choosing the right average for a skewed dataset (real-world / applied case)
A real-estate listing site wants to advertise the "average home price" in a neighborhood with home values of $310,000, $325,000, $340,000, $355,000, and one recently sold mansion at $2,100,000. The mean, (310,000+325,000+340,000+355,000+2,100,000) ÷ 5 = $686,000, would make the neighborhood look far pricier than it actually is for a typical buyer — four of five homes sit under $360,000. The median, $340,000, is a far more honest summary of what a buyer should expect to pay, since the mansion (an outlier) barely affects the median's position. This is exactly the same reasoning that leads statisticians to report median income rather than mean income, and it's why "average home price" listings that use the mean can be quietly misleading in neighborhoods with even one very high-value property.
How it works (visual)
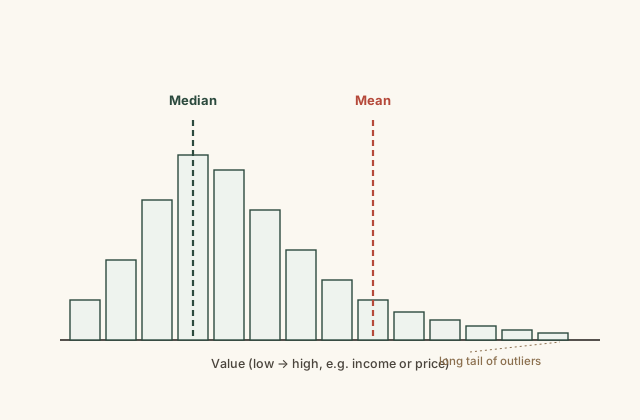
The long right-hand tail in the histogram represents a small number of unusually large values — an outlier salary, an outlier home price. The median marker stays anchored inside the main cluster of bars, since it only depends on sorted position; the mean marker gets dragged toward the tail, since every value in that tail contributes its full magnitude to the sum. The bigger the gap between the two marker lines, the more skewed the dataset is, and the less representative the mean is of a typical value in it.
Common mistakes
Common Mistakes
Finding the median without sorting the data first.
→ Always sort the values from smallest to largest before picking out the middle one — the median of an unsorted list, read in its original order, is meaningless.
Picking a single middle value for the median of a dataset with an even number of entries, instead of averaging the two middle values.
→ With an even count, sort the data and average the two values that land in the middle positions — don't just pick the higher or lower of the two.
Defaulting to the mean for every dataset, even ones with outliers or a skewed shape.
→ Check whether the data has extreme outliers or a long tail first. If it does, the median usually represents a 'typical' value far more honestly than the mean does.
Common misconception
“The mean (average) always represents a typical value that's close to what most entries in the dataset look like.”
Not when a dataset has outliers. In the salary example above, the mean was $139,000 even though four of the five employees earned between $45,000 and $52,000 — nobody in that group earns anywhere close to the mean. The mean is a mathematical balance point (it's the value where the sum of distances above it equals the sum of distances below it), not a promise that most values cluster near it. This is precisely why the U.S. Census Bureau and similar statistical agencies report median household income rather than mean household income: the median is far more resistant to being dragged off-target by a small number of very high earners.
A dataset is 3, 4, 4, 5, 4000. Does the mean of this dataset represent a value that's close to most of the entries?
Try it yourself
What to do next
What to do next
- For any dataset you're summarizing, compute all three — mean, median, and mode — at least once, and notice how far apart they land.
- Before quoting a mean as 'typical,' scan the data for outliers first. A single extreme value is often enough to make the mean a poor summary.
- Practice finding the median of a dataset with an even number of entries, to build the habit of averaging the two middle values instead of picking just one.
- Read the related entry on Percentages Explained to see how mean and median interact with percentage-based comparisons like year-over-year change.