Data Collection & Sampling Basics: How Surveys Get Accurate Results from a Small Group
Sampling is the practice of studying a smaller, carefully chosen subset of a population to draw conclusions about the whole group without surveying everyone.
Reading time
— 5 min
Updated
— Aug 16, 2026
Fact-reviewed
— Aug 16, 2026
Key Takeaways
Key Takeaways
1A census counts every member of a population; a sample studies a smaller, carefully chosen subset — well-designed samples can be highly accurate without surveying everyone.
2Random sampling, where every member of the population has a known chance of being selected, is what makes drawing conclusions from a sample statistically valid — convenience sampling introduces bias that no sample size can fix.
3Sample size affects precision (margin of error), but a biased sampling method produces the wrong answer no matter how large the sample gets — bigger is not automatically more accurate.
The concept
Instead of asking every single person in a huge group a question, researchers usually ask a much smaller sample and use those answers to estimate what the whole population thinks. This works the same way a chef tastes one spoonful of soup to judge the whole pot — as long as the spoonful is stirred in well (representative) rather than scooped from just the top (biased), one small taste tells you a lot about the entire pot.
That contrast — a huge but biased sample losing to a small but random one — is the single most important idea in sampling, and it's worth walking through with real numbers to see exactly why size alone never fixes a bad method.
Quick check
A poll of 2.4 million self-selected magazine subscribers predicts one outcome. A separate poll of just 50,000 randomly selected people predicts the opposite. Historically, which one is more likely to be right?
Worked examples
Example 1: A simple random sample (baseline case)
A school has 800 students and wants to know what percentage prefer pizza over tacos for the cafeteria menu. Instead of asking all 800, the school randomly selects 80 students (10% of the population) using a random number generator applied to the full enrollment list, so every student has an equal, known chance of being picked. Suppose 56 of the 80 sampled students prefer pizza: 56 ÷ 80 = 70%. Because the sample was randomly drawn, the school can reasonably estimate that close to 70% of all 800 students prefer pizza — not exactly 70%, but within a calculable margin of error, without needing to survey all 800.
Example 2: Stratified sampling to protect a small subgroup (edge case / variation)
A company has 1,000 employees: 700 in operations and 300 in management. A simple random sample of 100 employees, drawn purely by chance, might by bad luck pull only 15 management employees instead of the expected 30 — underrepresenting that group's views. A stratified sample avoids this by sampling proportionally within each group: 10% of operations (70 people) and 10% of management (30 people), for the same 100-person total, but now guaranteed to reflect each group's actual share of the company. This matters most when a subgroup is both small and likely to have different opinions from the majority — exactly the situation where pure random chance is most likely to accidentally under-sample it.
Quick check
An online news site posts a poll on its homepage asking readers to click a button voting on a political issue. 40,000 people vote. What is the biggest problem with treating this as representative of the general public's opinion?
Example 3: Interpreting a national poll's margin of error (real-world / applied case)
A national poll surveys 1,000 randomly selected adults and reports that 52% support a particular policy. Using the common rule-of-thumb approximation for margin of error at a 95% confidence level, E ≈ 100 ÷ √n percentage points: 100 ÷ √1,000 = 100 ÷ 31.6 ≈ ±3.2 percentage points. That means the true population figure is estimated to fall somewhere between roughly 48.8% and 55.2% — so a reported 52%-to-48% split is close enough to the margin of error that it shouldn't be read as a decisive result. Because this formula depends only on sample size (not on the size of the population being estimated), a properly randomized sample of 1,000 gives roughly the same ±3.2-point precision whether it's estimating opinion in a city of 300,000 or a country of 300 million.
How it works (visual)
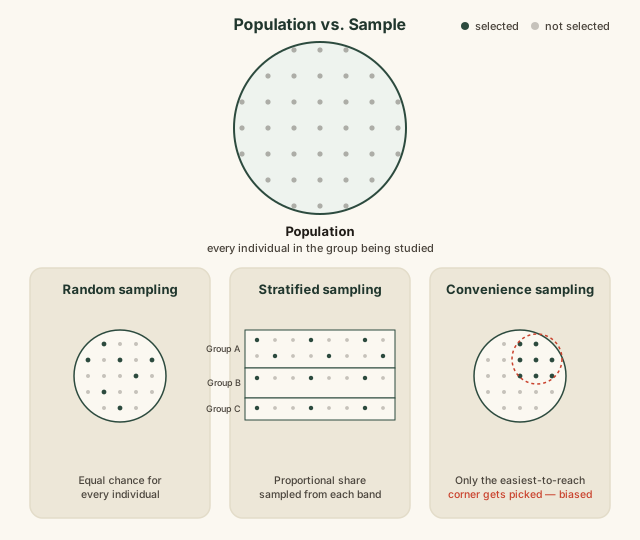
Population vs. sample, and three sampling methods compared
Notice that random and stratified sampling both pull selected individuals (highlighted dots) from across the entire population circle, while convenience sampling pulls only from one accessible corner — visually, that clustering is exactly what produces sampling bias, regardless of how many dots are selected from that corner. Stratified sampling adds a further refinement over plain random sampling by guaranteeing each labeled subgroup band contributes its correct proportional share, closing the small-subgroup gap described in Example 2.
Common mistakes
Common Mistakes
✕
Assuming a very large sample automatically means accurate results, regardless of how the sample was selected.
→ Check the selection method first. A huge but biased sample (like self-selected online voters) can be far less accurate than a small, properly randomized one.
✕
Treating a convenience sample — surveying whoever's easiest to reach — as representative of a broader population.
→ Ask who was excluded from having a chance to be included. If entire groups couldn't realistically end up in the sample, the results only describe the group that was actually reachable.
✕
Reporting a single sample result (like '52% support') as an exact population value, ignoring the margin of error.
→ Always pair a sample result with its margin of error, and treat differences smaller than that margin as statistically inconclusive rather than a clear result.
Common misconception
“A bigger sample size is always needed to get an accurate result, no matter how large the underlying population is.”
Once a population is much larger than the sample, margin of error depends almost entirely on the sample's size, not on the population's size. A properly randomized sample of 1,000 people gives roughly the same ±3.2 percentage-point precision whether it's estimating opinion in a city of 300,000 people or a country of 300 million — this is why national polls don't need millions of respondents to be reasonably accurate. What actually improves accuracy is a larger and properly randomized sample, or reducing bias in how people are selected — not simply chasing a bigger number for its own sake, and definitely not at the cost of random selection.
Quick check
A researcher wants to estimate opinion accurately in both a small city (50,000 people) and an entire country (50 million people). Does the country-level poll need a dramatically larger sample to achieve the same precision as the city-level poll?
Try it yourself
Approximate sample size needed for a target margin of error (95% confidence, worst-case)
Approximate required sample size384.16
What to do next
What to do next
Next time you see a poll or survey result, look for how the sample was selected before trusting the headline number — random beats large every time.
Try the calculator above with a margin of error of 2% versus 5% to see how much bigger a sample needs to get for tighter precision.
When you spot an online 'vote in our poll' feature, recognize it as a convenience sample, not a representative measurement of public opinion.
Read the related entry on Probability Basics to see the theoretical-vs-experimental probability idea that underlies why sampling works at all.
FAQ
FAQ
Related terms
Related terms
Population
The entire group a researcher wants to draw conclusions about, such as all registered voters in a country.
Sample
A smaller subset of a population that is actually surveyed or measured, used to draw conclusions about the whole population.
Random sampling
A sampling method where every member of the population has a known, non-zero chance of being selected, which is what makes statistical inference from the sample valid.
Stratified sampling
A sampling method that divides the population into subgroups (strata) and samples proportionally from each, to guarantee smaller subgroups are represented.
Convenience sampling
A non-random sampling method that surveys whoever is easiest to reach, which typically produces a biased, non-representative sample regardless of size.
Sampling bias
A systematic error where certain members of a population are more or less likely to be included in a sample than others, skewing results regardless of sample size.
Margin of error
A measure of the expected range of uncertainty in a sample's result, driven mainly by sample size, expressed as a plus-or-minus percentage.
A $100 item gets 20% off, and then a 20% coupon is applied to the already-discounted price. Is the final price the same as taking a flat 40% off the original $100?
This entry was researched from public sources and drafted with AI-assisted tools, then edited — errors are still possible. Spot one, or want a topic covered? Read our disclaimer.
 KnowThis