 KnowThis
Key Takeaways
Key Takeaways
- 1A poll's margin of error is a mathematical consequence of surveying a sample instead of the entire population — it shrinks as the sample size grows, but never disappears entirely for a sample smaller than the full population.
- 2A poll showing candidate A at 48% and candidate B at 45%, with a margin of error of ±3 points, is a statistical tie — the true gap could plausibly run the other direction.
- 3Margin of error alone doesn't capture every source of poll error — how the sample was selected (truly random vs. convenience) and question wording both matter just as much and aren't reflected in that single number.
The concept
Reading a poll correctly means treating the headline number and the margin of error as one combined statement, not two separate pieces of information — the number by itself, without its margin, is genuinely incomplete.
A poll reports Candidate A at 47% and Candidate B at 44%, with a stated margin of error of ±3 percentage points. Is this a clear lead for Candidate A?
Worked examples
Example 1: Reading a standard national poll (baseline case)
Example 2: Why quadrupling the sample only halves the margin (edge case / variation)
Example 3: A poll with a low response rate and what it means for accuracy (real-world / applied case)
A pollster doubles their sample size from 1,000 to 2,000 respondents, expecting the margin of error to roughly halve. What actually happens?
How it works (visual)
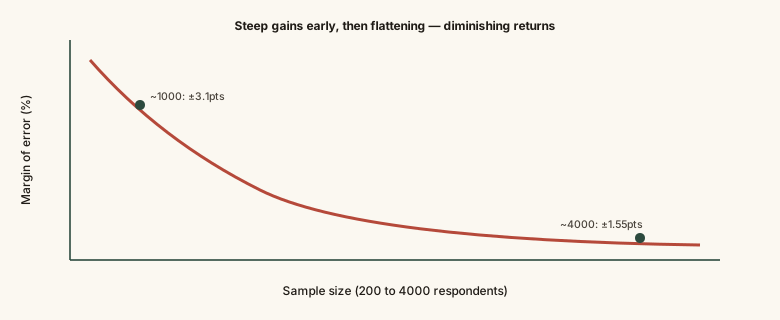
The steep drop at small sample sizes, followed by a flattening curve, is exactly why most national polls converge on roughly 1,000 to 1,500 respondents as a practical balance point rather than chasing much larger, more expensive samples.
Common mistakes
Common Mistakes
Comparing two candidates' headline poll numbers without accounting for the margin of error on each.
→ Check whether the gap between the two numbers is smaller than roughly two times the margin of error — if so, treat the race as a statistical toss-up rather than a confirmed lead.
Assuming a poll with a larger, more expensive sample is proportionally more accurate than a smaller one.
→ Remember the square-root relationship — going from 1,000 to 4,000 respondents only cuts the margin of error roughly in half, not to a quarter.
Treating margin of error as the only source of potential poll inaccuracy.
→ Also check how the sample was selected (truly random vs. an online opt-in panel) and whether questions were worded neutrally — both matter and neither shows up in the reported margin of error.
Common misconception
“A poll's margin of error accounts for every possible source of inaccuracy in the result.”
Margin of error specifically quantifies sampling variability — the uncertainty from surveying a subset rather than everyone. It does not capture non-response bias (systematic differences between people who answer and people who don't), question-wording effects, or an unrepresentative sampling method. A poll can have a small, precisely reported margin of error and still be meaningfully biased for reasons the margin of error doesn't measure at all.
Try it yourself
This uses the standard worst-case formula (assuming a 50/50 population split, the scenario requiring the largest sample) at a 95% confidence level — the actual sample size a real pollster needs can be somewhat smaller if the true population split isn't close to 50/50.
What to do next
What to do next
- When reading a close poll result, check whether the gap between candidates is smaller than roughly two margins of error before treating it as a real lead.
- Look up how a poll's sample was selected (random-digit-dial phone survey vs. online opt-in panel) — this matters as much as the margin of error itself.
- Be skeptical of a single poll; check for polling averages across multiple independent polls, which reduce the impact of any one poll's individual error.
- Remember margin of error only covers sampling uncertainty — it says nothing about question wording or non-response bias.