 KnowThis
Key Takeaways
Key Takeaways
- 1A learning curve plots proficiency against amount of practice — for nearly every real skill it bends, with fast early gains and progressively smaller later gains, rather than rising in a straight line.
- 2Flat stretches (plateaus) are a normal, expected part of the curve's shape, not necessarily evidence of a hard performance ceiling.
- 3Curves approach a performance ceiling but rarely reach it exactly — the same amount of additional practice buys less improvement the closer a skill gets to that ceiling.
The concept
Once the shrinking-gap mechanism is visible, the practical read is: slower gains later on aren't a sign that practice has stopped working, and a flat stretch is a cue to check whether the current strategy has been maxed out, not necessarily a hard stopping point.
Why does a typical learning curve show fast gains early and progressively slower gains later, even with steady practice?
Worked examples
Example 1: A new typist's words-per-minute over weeks (baseline case)
A new typist tracks words-per-minute weekly. In weeks one and two, speed jumps sharply as they learn where the keys actually are. By weeks five and six, with the same daily practice time, weekly gains are much smaller, even though the typist is still improving every week. Plotted out, the result is a curve that rises steeply and then bends toward flatter — not a straight line climbing at the same rate throughout.
What does the typist's slower weekly gain in week six, compared to week one, most likely indicate?
Example 2: A plateau broken by a strategy change (edge case / variation)
A language learner practicing conversation daily hits a multi-week plateau at an intermediate level — measured gains flatten out despite continued daily solo review. After switching from solo review to real conversation practice with a partner who gives live feedback, measurable gains resume within a couple of weeks. The plateau wasn't a hard ceiling; it was the limit of what solo review alone could produce.
What does the resumption of gains after switching to conversation practice with live feedback suggest about the earlier plateau?
Example 3: Two employees learning new software (real-world / applied case)
Two employees start learning the same new software tool. Both see fast gains in the first two weeks. Going into week three, one employee expected that fast rate to continue in a straight line, gets discouraged when the visible gains shrink, and quietly stops putting in deliberate effort. The other expected the curve to bend based on past experience learning new tools, and keeps practicing through the slower-gain period. A month later, the second employee is noticeably more proficient — not because they practiced harder in week one, but because they didn't mistake a normal bend in the curve for a sign to stop.
What mainly explains the proficiency gap between the two employees a month later?
How it works (visual)
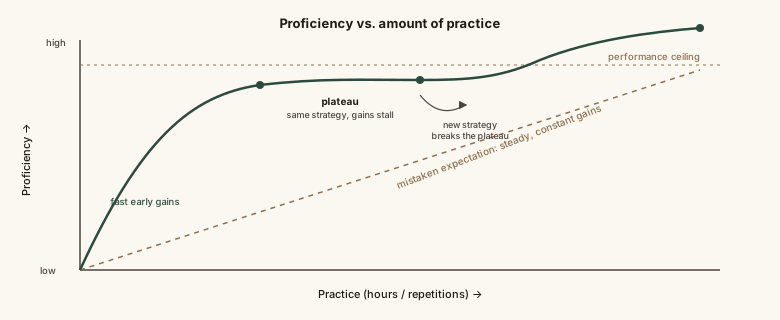
The gap between the dashed straight line and the solid actual curve is where most discouragement during self-directed learning comes from — expecting the line, then living the curve.
Common mistakes
Common Mistakes
Expecting constant, straight-line gains and getting discouraged when early fast progress inevitably slows down.
→ Expect the curve to bend from the start — slower later gains are the normal shape of skill acquisition, not a sign that practice has stopped working.
Treating any flat stretch as proof of a hard, permanent limit.
→ Check whether the current strategy has been maxed out before assuming a ceiling — a genuinely different technique, tool, or feedback source often reopens progress.
Comparing your own curve's shape at a given stage to someone else's curve at a different stage, and concluding you're behind.
→ Compare your progress to your own earlier measurements over time, since curve shape and pace both vary by skill, method, and person.
Common misconception
“If I'm not seeing daily improvement, I've plateaued for good and hit my natural limit.”
Flat stretches are a normal, expected part of most learning curves, not necessarily evidence of a hard ceiling. A plateau most often reflects having maxed out the current practice strategy — genuine hard limits do exist, but they're far less common than perceived plateaus. Before concluding a limit has been reached, it's worth changing something concrete about the method — a different technique, a new feedback source, or a harder stretch target — since that's what typically reopens a new, steeper segment of the curve.
Try it yourself
Using the same diminishing-returns learning-curve model, estimate roughly what proficiency level a given number of practice hours would reach, given a 'characteristic learning rate' for that skill.
A simplified illustrative model, not a measured prediction for any specific skill — real curves vary by person, method, and domain, and often include plateaus this simple model doesn't capture.
What to do next
What to do next
- Track a measurable indicator of your own progress over time, rather than relying on how fast progress feels.
- Expect the curve to bend — plan for slower visible gains later, so you don't mistake the normal shape for a stall.
- When you hit a flat stretch, change something concrete in your method before assuming you've hit a hard ceiling.
- Compare your progress against your own earlier measurements, not against someone else's curve at a different stage.