Budgeting math allocates income by percentage across spending categories, while shopping math compares unit price — cost per unit of quantity — rather than sticker price alone.
Reading time
— 5 min
Updated
— Sep 24, 2026
Fact-reviewed
— Aug 16, 2026
Key Takeaways
Key Takeaways
1Budgeting math is percentage allocation: you assign each dollar of income a category share, like the well-known 50/30/20 split between needs, wants, and savings.
2Comparing prices while shopping means computing unit price — price divided by quantity — because package sizes rarely match, and the sticker price alone can mislead.
3Small recurring costs compound arithmetically fast: a $5 daily habit is $150 a month and $1,825 a year, numbers that feel very different from 'just five dollars.'
The concept
Budgeting math is mostly about splitting income into percentages. A common rule of thumb is 50/30/20: 50% of income to needs (rent, groceries, utilities), 30% to wants (dining out, entertainment), and 20% to savings and debt paydown. If you earn $3,000 a month after taxes, that's $1,500 needs, $900 wants, and $600 savings. Shopping math is a separate but related skill — figuring out which of two differently-sized packages is actually the better deal by comparing unit price (cost per ounce, per item, per liter) instead of just looking at which price tag is bigger or smaller.
That unit-price idea sounds obvious in the abstract, but store shelves are specifically designed to make sticker-price comparisons easy and unit-price comparisons hard — different brands sell in different-sized containers on purpose.
Quick check
A 12-ounce bottle of juice costs $3.60. A 16-ounce bottle of the same juice costs $4.80. Which is the better deal per ounce?
Worked examples
Example 1: A 50/30/20 budget on a real paycheck (baseline case)
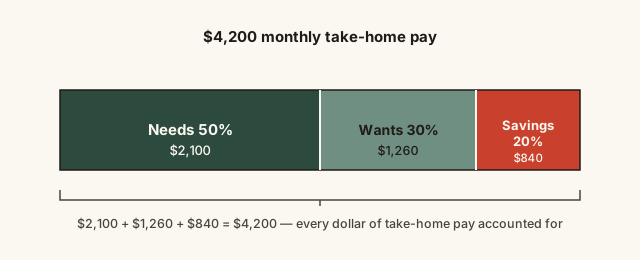
Take-home pay of $4,200 a month. Needs (50%): 4,200 × 0.50 = $2,100. Wants (30%): 4,200 × 0.30 = $1,260. Savings and debt paydown (20%): 4,200 × 0.20 = $840. Check the total: 2,100 + 1,260 + 840 = 4,200 — the three categories account for every dollar of take-home pay, which is the entire point of allocating by percentage rather than guessing category-by-category and hoping it adds up.
Example 2: Budgeting around biweekly pay, not monthly pay (edge case / variation)
Someone paid $1,800 every two weeks assumes $3,600 a month (two paychecks × $1,800). But 52 weeks ÷ 2 = 26 pay periods a year, and 26 × $1,800 = $46,800 a year — while 12 months × $3,600 = $43,200. The $3,600 monthly figure undercounts actual annual income by $3,600, because two months each year receive three paychecks instead of two (this happens whenever a pay date falls at the start, middle, and end of the same calendar month). Treating those "extra" paychecks as a predictable bonus for savings or debt paydown, rather than spending them as if they were ordinary monthly income, avoids both under- and over-budgeting across the year.
Quick check
Someone paid biweekly ($1,800 every two weeks) assumes their monthly income is always $3,600. What's the actual issue with this assumption?
Example 3: Comparing store-brand package sizes with unit price (real-world / applied case)
A store shelf has three sizes of the same cereal: a 12-ounce box for $3.99, an 18-ounce box for $5.49, and a 24-ounce "family size" box for $7.99. Unit prices: 3.99 ÷ 12 = $0.333/oz, 5.49 ÷ 18 = $0.305/oz, 7.99 ÷ 24 = $0.333/oz. The middle size is actually the cheapest per ounce — the largest "family size" box, despite looking like the obvious bulk-savings choice, ties with the smallest box instead of beating it. This is a common real-world pattern: retailers don't guarantee larger packages are proportionally cheaper, and the only way to know is to check unit price directly, which many stores print on the shelf tag in small print specifically for this reason.
Quick check
On the cereal shelf, the 24-ounce 'family size' box has the same unit price as the smallest 12-ounce box, while the mid-size 18-ounce box is actually cheapest per ounce. What does this demonstrate?
How it works (visual)
A $4,200 paycheck split by the 50/30/20 rule
The bar's full width represents 100% of take-home pay, and each segment's width is proportional to its percentage — this is exactly why percentage allocation works for budgeting regardless of income size: double the income and every segment doubles too, but the proportions (and the underlying logic) stay identical. The same visual logic applies to unit price comparisons — picture each package's price as a bar scaled to its quantity, and the "true" comparison is the slope (price per unit), not the bar's raw height (total price).
Common mistakes
Common Mistakes
✕
Budgeting off gross (pre-tax) income instead of net take-home pay.
→ Use the amount that actually lands in your bank account after taxes and deductions — budgeting off gross income overstates what's really available and leads to overspending.
✕
Building a monthly budget around biweekly pay without accounting for the two 'three-paycheck' months each year.
→ Multiply the per-paycheck amount by 26 and divide by 12 for a true monthly average, or treat the extra paychecks as a separate annual bonus for savings.
✕
Comparing sticker price instead of unit price when choosing between package sizes.
→ Divide price by quantity for each option before deciding — many stores print unit price on the shelf tag specifically so shoppers can skip doing the division by hand.
Common misconception
“The bigger package size is always the better value per unit.”
Not necessarily. Retailers price different package sizes somewhat independently — sometimes a "family size" box genuinely costs less per ounce, and sometimes, as in the cereal example above, it ties or even loses to a smaller size. The only reliable check is computing unit price (price ÷ quantity) directly for each option, not assuming a direction based on size alone.
Quick check
Why can't you assume the largest package size is automatically the cheapest per unit without checking?
Try it yourself
50/30/20-style budget category calculator
Amount allocated to this category ($)$2,100
What to do next
What to do next
Run your own take-home pay through the 50/30/20 split above and compare it to what you're actually spending in each category.
If you're paid biweekly, calculate your true monthly average (paycheck × 26 ÷ 12) instead of assuming exactly two paychecks every month.
Next time you're comparing two package sizes at the store, divide price by quantity for both before deciding — don't trust size alone.
Track one small recurring purchase (coffee, a subscription) for a month and multiply it out to a full year to see its real annual cost.
FAQ
FAQ
Related terms
Related terms
Budget allocation
The portion of income assigned to a specific spending category, usually expressed as a percentage of total income.
Unit price
The cost of a product divided by its quantity (per ounce, per liter, per item), used to compare differently sized packages on equal footing.
Take-home pay
Income remaining after taxes and payroll deductions — the actual amount available to budget, as opposed to gross pay.
Fixed expense
A recurring cost that stays roughly the same each period, like rent or a loan payment, as opposed to a variable expense like groceries.
This entry was researched from public sources and drafted with AI-assisted tools, then edited — errors are still possible. Spot one, or want a topic covered? Read our disclaimer.
 KnowThis