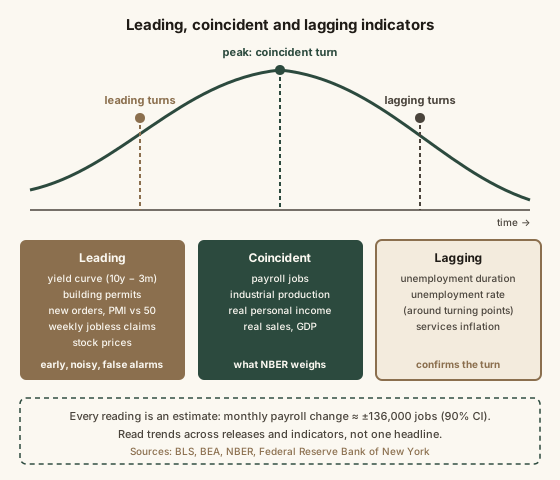
Economic indicators are regularly published measurements of the economy, and their meaning depends on timing. Leading indicators, such as the Treasury yield curve, building permits, new factory orders, weekly jobless claims and stock prices, tend to turn before the overall economy does. Coincident indicators, such as payroll employment, industrial production and real personal income, move with it, and are what the National Bureau of Economic Research weighs when it dates recessions. Lagging indicators, such as the unemployment rate after a turning point and the duration of unemployment, confirm a change after it has happened. Every indicator is an estimate with noise: the Bureau of Labor Statistics puts the 90% confidence interval on the monthly payroll change at roughly plus or minus 136,000 jobs, and GDP and payroll figures are revised as more data arrives. Read indicators as a trend across several releases and sources, not as a single headline number, and remember that even strong signals such as an inverted yield curve have produced false alarms.
Reading time
— 6 min
Updated
— Oct 8, 2026
Fact-reviewed
— Oct 8, 2026
Key Takeaways
Key Takeaways
1Economic indicators come in three timings: leading (yield curve, building permits, jobless claims) turn before the economy, coincident (payroll jobs, industrial production) move with it, lagging (unemployment duration) confirm afterwards.
2Every indicator is an estimate. The BLS puts the 90% confidence interval on the monthly payroll change at roughly plus or minus 136,000 jobs, and GDP and payroll numbers are routinely revised.
3The signal is the trend across several releases and several indicators, not one headline. Even the yield curve, the most famous leading signal, has given false alarms.
The concept
Think of the economy as a long freight train. Some signals are like the engine at the front: they turn first. When builders take out fewer permits, when factories get fewer new orders, when more people file for unemployment each week, the rest of the train often follows months later. Those are leading indicators. Other signals are the middle carriages, moving at the same time as the whole economy: the number of people on payrolls, how much factories produce, how much income people have after inflation. Those are coincident. Then there's the caboose: signals that turn last, like how long unemployed people have been looking for work. Those are lagging, useful for confirming a turn that's already happened. The catch is that every one of these numbers is an estimate, gathered from surveys and records, and the first number published is often revised. So the useful habit isn't to react to one headline. It's to ask which kind of signal it is, how noisy it is, and whether other signals agree.
The monthly jobs report shows payrolls rose by 60,000, down from 180,000 the month before. A headline calls it 'a hiring collapse.' What's the most accurate reading?
Worked examples
Example 1: Turning a monthly CPI change into an annual pace (baseline case)
The BLS reports that the Consumer Price Index rose 0.2% in a month. What does that signal? On its own, a month is small, so analysts translate it into an annual pace: 1.002 multiplied by itself 12 times is about 1.024, or roughly 2.4% a year. A 0.4% month, by the same arithmetic, is about 4.9% a year. The other figure in every CPI release is the year-over-year change, comparing the index with the same month a year earlier. The two can disagree: year-over-year inflation can still read 3% while recent months run at a 2% pace, because the annual figure includes older months. When they diverge, the monthly pace tells you the direction; the annual figure tells you where the level has been.
Example 2: The jobs number that changed (edge case)
Suppose the first estimate says payrolls rose by 150,000 in a month. Over the next two monthly reports, as more employer surveys arrive, it's revised to 110,000 and then 90,000, and the annual benchmark later adjusts it again. That's ordinary, not a scandal: the first estimate is built from the responses that have come in by deadline. It also sits inside the BLS 90% confidence interval of roughly ±136,000 for a monthly change. The lesson is to read the three-month average and the revisions, not just the headline. Three months of +90,000, +110,000 and +70,000 average 90,000, a clearer signal than any one of them.
Example 3: Reading a GDP headline and the yield curve together (applied case)
BEA reports that real GDP grew at a "2.0% annual rate" last quarter. That doesn't mean the economy grew 2% in three months. It grew about 0.5% in the quarter, and 1.005 to the fourth power is about 1.020, so the annualized rate is 2.0%. At the same time, suppose the 3-month Treasury bill yields 4.5% and the 10-year note 4.0%: the spread is −0.5 percentage points, an inverted curve. The coincident data say the economy is growing now; the leading signal says markets expect slower growth or rate cuts ahead. Neither cancels the other. The honest reading is "growing for now, with a raised but uncertain risk of slowing," and the next step is to check other leading measures, such as weekly jobless claims and new orders, for confirmation. For how the Fed reads the same data, see what the Federal Reserve does.
Quick check
Which set of indicators would give the earliest warning that the economy might be about to slow?
How it works (visual)
Leading, coincident and lagging indicators
The timeline shows why the same week's data can look contradictory. Leading measures may already be weakening while coincident ones still look healthy, and lagging ones look worst well after the turn has passed.
Common mistakes
Common Mistakes
✕
Reacting to a single month's jobs or inflation number.
→ Look at three-month averages and the revisions in later reports. One month is within the survey's noise.
✕
Reading an annualized GDP figure as the quarter's actual growth.
→ U.S. GDP headlines are annualized. Divide roughly by four for the actual quarterly change.
✕
Treating a yield-curve inversion as a recession countdown.
→ It has preceded most recessions since the late 1960s, but lead times vary widely and it has given false signals. Check other indicators.
✕
Using the unemployment rate to spot a downturn early.
→ It tends to lag at turning points. Weekly initial jobless claims respond faster.
Common misconception
“Two quarters of falling GDP is the official definition of a U.S. recession, so GDP is the indicator that decides it.”
The NBER's Business Cycle Dating Committee doesn't use the two-quarter rule. It looks for a significant decline in activity spread across the economy, lasting more than a few months, and weighs employment, real income, spending and industrial production alongside GDP. GDP is also published late and revised, so it's one input among several, not the switch. The two-quarter shorthand often matches, but not always.
What to do next
What to do next
When you see an economic headline, first ask: is this a leading, coincident or lagging indicator?
Check whether the figure is annualized, monthly or year-over-year before comparing it with anything else.
Look for the revision to last month's number in the same release; it often matters as much as the new figure.
Compare at least two or three indicators before concluding the economy is turning.
Go to the source release (BLS, BEA, the New York Fed) for the technical note on how the number is measured.
FAQ
FAQ
Related terms
Related terms
Leading indicator
A measure that tends to change direction before the overall economy does, such as the yield curve, building permits or new orders.
Coincident indicator
A measure that moves at the same time as the overall economy, such as payroll employment, industrial production and real personal income.
Lagging indicator
A measure that changes after the economy has already turned, confirming a shift, such as the average duration of unemployment.
Yield curve inversion
When short-term Treasury rates rise above long-term rates. It has preceded most U.S. recessions since the late 1960s, though not on a fixed timetable.
Annualized rate
A one-month or one-quarter change scaled up to show what it would be if it continued for a full year. U.S. GDP growth headlines are reported this way.
Revision
A later update to an already published figure as more complete data arrives. GDP and monthly payroll numbers are routinely revised.
This entry was researched from public sources and drafted with AI-assisted tools, then edited — errors are still possible. Spot one, or want a topic covered? Read our disclaimer.
 KnowThis