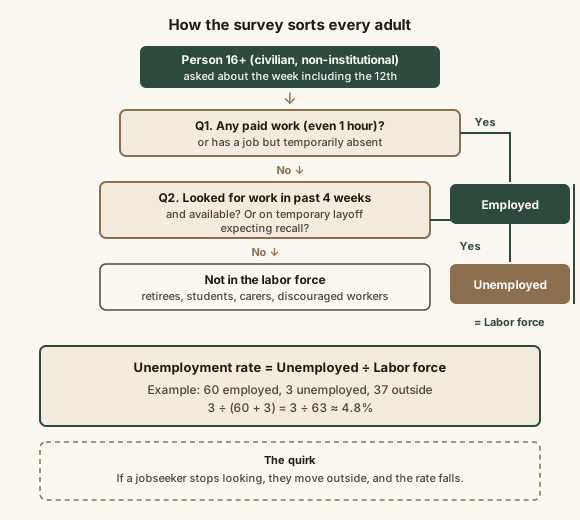
The official U.S. unemployment rate is calculated from the Current Population Survey (CPS), a monthly survey of about 60,000 eligible households (roughly 110,000 people) run by the Census Bureau for the Bureau of Labor Statistics. It is not a count of people claiming unemployment benefits. Each person 16 or older (excluding people in institutions and the military) is classified for the reference week, generally the week including the 12th, as employed (did any paid work, even one hour, or was temporarily absent from a job), unemployed (had no job, was available to work, and actively looked for work in the past four weeks, or was on temporary layoff expecting recall), or not in the labor force (everyone else, including retirees, students and people who've stopped looking). The labor force is employed plus unemployed, and the unemployment rate is unemployed divided by the labor force. So if 3 of every 63 people in the labor force are unemployed, the rate is about 4.8%. Because people who stop searching leave the labor force, the rate can fall without anyone finding a job; BLS's broader U-6 measure adds discouraged and marginally attached workers and people working part time for economic reasons. Monthly changes of about 0.2 percentage point or less are often within sampling error. In October 2025, a federal shutdown prevented collection, so that month's rate was never produced.
Reading time
— 6 min
Updated
— Oct 3, 2026
Fact-reviewed
— Oct 3, 2026
Key Takeaways
Key Takeaways
1The U.S. unemployment rate comes from a monthly survey of about 60,000 households, not from counting benefit claims.
2You're 'unemployed' only if you had no job, were available, and actively looked in the past four weeks (or are on temporary layoff).
3Rate = unemployed ÷ labor force. People who aren't working or looking are outside the calculation entirely.
4So the rate can fall when discouraged people stop searching, which is why economists also watch U-6 and labor force participation.
The concept
Most people assume the government counts everyone collecting unemployment checks. It doesn't. Every month, interviewers contact about 60,000 households, roughly 110,000 people, and ask simple questions about the previous week: did you do any paid work? If not, were you looking for work, and could you have started? Each adult lands in one of three boxes. Employed: did any paid work, even one hour. Unemployed: no job, but actively looking and available. Not in the labor force: everyone else, like retirees, full-time students, stay-at-home parents and people who've given up looking. Think of it like a race. The unemployment rate only counts runners on the track: the ones running (employed) and the ones trying to get back in (unemployed). People sitting in the stands aren't part of the calculation at all. Divide the unemployed by everyone on the track and you get the rate. That's why the number can drop even when nobody new finds a job: some runners just walked off the track.
Quick check
A retired teacher isn't working and isn't looking for work. How does the survey classify her?
Worked examples
Example 1: A town of 100 adults (baseline case)
Imagine a town with 100 adults 16 and over. 60 did some paid work last week: employed. 3 had no job, sent applications in the past month and could start tomorrow: unemployed. The other 37 are retirees, students, full-time caregivers and people not looking: not in the labor force. The labor force is 60 + 3 = 63. The unemployment rate is 3 ÷ 63 ≈ 4.8%, not 3% (which divides by all 100 adults) and not 40% (which counts everyone not working). The labor force participation rate is 63 ÷ 100 = 63%. Two numbers together tell you far more than one: how many people want work, and how many of them can't find it.
Example 2: The rate falls, but nobody got a job (edge case)
Same town, next month. Two of the three unemployed people stop searching because they've concluded there's nothing out there for them. They're now discouraged workers and move to "not in the labor force". Employed is still 60. Unemployed is now 1. Labor force is 61. The rate drops to 1 ÷ 61 ≈ 1.6%, a dramatic "improvement" in which no one found work. This is why economists never read the headline rate alone. The participation rate fell from 63% to 61%, and BLS's broader U-6 measure, which still counts those two discouraged workers, would barely move. Real-world shifts are smaller, but the direction of the effect is real.
Example 3: Reading a jobs-report headline (applied case)
A headline says "Unemployment rises to 4.2% from 4.1%". Three checks. First, is it significant? BLS's rule of thumb is that a one-month change of about 0.2 point is needed to be statistically significant at 90% confidence, so a 0.1-point move may be sampling noise. Second, why did it move? If participation rose because more people started looking, a slightly higher rate can be a sign of confidence rather than distress. Third, what else moved? Check U-6 and the payroll survey's job count. For context on scale, the rate peaked at 10.0% in October 2009 after the financial crisis and was first reported at 14.7% for April 2020, the highest since the series began in 1948. A 0.1-point move is a different kind of news. Around turning points the rate also tends to lag the economy, which is why it's read alongside faster-moving data; see what economic indicators actually signal.
Quick check
Two unemployed people stop looking for work and nothing else changes. What happens to the official rate?
How it works (visual)
How every adult is sorted, and where the rate comes from
The second question does all the work. Whether you searched in the past four weeks decides whether you're "unemployed" or outside the calculation entirely, which is why the same jobless person can raise or lower the rate depending on whether they're still looking.
Common mistakes
Common Mistakes
✕
Assuming the rate counts people on unemployment benefits.
→ It comes from a household survey. Benefit claims are a separate weekly statistic, and many unemployed people never claim.
✕
Dividing by the whole population.
→ The denominator is the labor force: employed plus unemployed.
✕
Reading a falling rate as automatically good news.
→ Check the participation rate and U-6. People giving up can lower the rate.
✕
Treating a 0.1-point monthly change as a trend.
→ Changes under about 0.2 point are often within sampling error. Look at several months.
✕
Thinking anyone without a job is 'unemployed'.
→ Officially, you must be available and actively searching, or on temporary layoff.
Common misconception
“The government calculates the unemployment rate by counting people who file for unemployment benefits.”
It doesn't. The rate comes from the Current Population Survey, a monthly interview of about 60,000 households. Benefit claims are tracked separately, and they miss many unemployed people, such as new graduates, people whose benefits ran out and people who never qualified. You can be counted as unemployed without ever filing a claim.
What to do next
What to do next
Next jobs Friday, read the BLS Employment Situation summary, not just the headline.
Check the labor force participation rate alongside the unemployment rate.
Look up U-6 in Table A-15 to see broader underutilization.
Before reacting to a monthly change, check whether BLS marks it as statistically significant.
Compare the household survey with the payroll survey's job count; when they disagree, look at several months.
FAQ
FAQ
Related terms
Related terms
Current Population Survey (CPS)
The monthly household survey, conducted by the Census Bureau for BLS, that produces the official U.S. unemployment rate.
Labor force
Everyone 16 and older (civilian, non-institutional) who is either employed or unemployed. People neither working nor looking are outside it.
Unemployed (official)
Had no job in the reference week, was available to work and actively looked for work in the previous four weeks, or was on temporary layoff expecting recall.
Labor force participation rate
The labor force as a share of the whole civilian non-institutional population 16 and older.
Discouraged worker
Someone who wants a job and has looked in the past year but stopped searching because they believe no jobs are available for them. Not counted as unemployed in U-3.
U-3 and U-6
BLS's official unemployment rate (U-3) and its broadest underutilization measure (U-6), which adds marginally attached workers and those part time for economic reasons.
Reference week
The week the survey asks about, generally the calendar week that includes the 12th of the month.
This entry was researched from public sources and drafted with AI-assisted tools, then edited — errors are still possible. Spot one, or want a topic covered? Read our disclaimer.
 KnowThis