Transportation modes are best compared by emissions per passenger-mile, not total vehicle emissions, since the same trip's environmental cost per rider depends heavily on occupancy — a single-occupant car produces far more CO2 per mile per person than the same car full of passengers, or than public transit running at typical ridership.
Reading time
— 4 min
Updated
— Aug 22, 2026
Fact-reviewed
— Aug 22, 2026
Key Takeaways
Key Takeaways
1The fair way to compare transportation modes is emissions per passenger-mile, not a vehicle's total emissions — occupancy changes the per-person number dramatically even on an identical trip.
2A single-occupant car trip produces far more CO2 per passenger-mile than the same trip made by public transit at typical ridership, or by carpooling with several passengers in the same car.
3Electric vehicles produce zero tailpipe emissions, but their true climate benefit depends on the electricity grid's fuel mix where they're charged — a well-to-wheel comparison, not tailpipe emissions alone.
The concept
A car, bus, and train each release a certain amount of CO2 per mile they travel. But what actually matters for comparing transportation choices is emissions per passenger-mile — the vehicle's emissions divided by how many people are actually riding. A car with one person in it looks far worse per-rider than the same car carrying four people on the same trip.
This doesn't mean any specific mode is always best — actual occupancy varies by route, time of day, and city, so the same public transit line can be a great or poor per-passenger choice depending on how full it typically runs. The comparison has to be made per passenger, not per vehicle.
Quick check
A city bus produces significantly more total CO2 per mile than a typical car. Does this mean taking the bus is always worse for the environment than driving alone?
Worked examples
Example 1: Carpooling changes per-passenger emissions directly (baseline case)
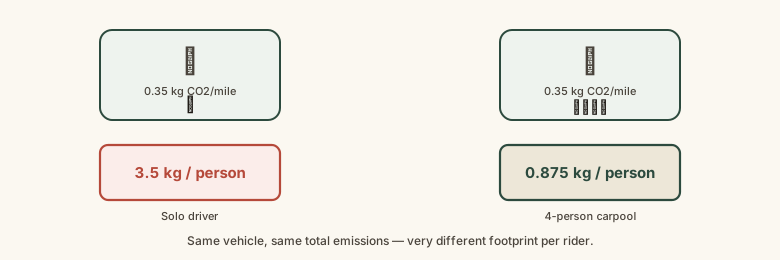
A car produces 0.35 kg of CO2 per mile driven, regardless of how many people are inside. Driven solo for a 10-mile commute, that's 3.5 kg of CO2 for one passenger-mile-equivalent trip. The same car carrying four coworkers on the same 10-mile commute still produces 3.5 kg total, but divided across four riders, that's 0.875 kg of CO2 per person — a 75% reduction in per-passenger footprint from carpooling alone, with no change to the vehicle or fuel.
Example 2: Why an EV's real benefit depends on the local grid (edge case / variation)
An electric vehicle charged on a grid that's predominantly hydroelectric or nuclear (very low-carbon electricity) has a dramatically lower well-to-wheel footprint than the same EV charged on a grid still heavily reliant on coal generation, even though both EVs have identical zero tailpipe emissions while driving. This is why blanket claims like "EVs are zero-emission" are only strictly true at the tailpipe — the well-to-wheel comparison, which includes how the electricity was generated, is the one that determines the vehicle's actual climate impact.
Quick check
Are two identical electric vehicles guaranteed to have the same real-world climate impact if one is charged in a region with a coal-heavy grid and the other in a region with a mostly hydroelectric grid?
Example 3: A city comparing transit investment against road expansion (real-world / applied case)
A city government evaluating whether to expand a highway or invest in a new light rail line uses per-passenger-mile emissions modeling (a real methodology used in federal transportation planning, including US DOT and FTA analyses) to project the climate impact of each option at expected future ridership and traffic volumes. This is exactly why serious transportation policy analysis focuses on projected occupancy-adjusted emissions rather than simply comparing a bus's or train's per-vehicle emissions against a highway lane's per-vehicle emissions.
How it works (visual)
The same car's per-passenger emissions with different occupancy
Both cars in the diagram have identical total emissions per mile — the only variable changing between them is how many people share that same fixed footprint, which is precisely the occupancy effect that makes per-passenger-mile the fair unit for comparing transportation choices.
Common mistakes
Common Mistakes
✕
Comparing transportation modes by total vehicle emissions instead of emissions per passenger-mile.
→ Always adjust for occupancy — a high-emission vehicle carrying many riders can have a lower per-passenger footprint than a low-emission vehicle carrying only one.
✕
Treating an electric vehicle's 'zero emissions' claim as the complete picture.
→ Consider the well-to-wheel footprint, which accounts for how the electricity used to charge the vehicle was generated — this varies meaningfully by region and grid mix.
✕
Assuming public transit is automatically the lower-emission choice regardless of how full the vehicle actually runs.
→ Recognize that a nearly empty bus or train can have a high per-passenger footprint too — the occupancy-adjusted comparison depends on real ridership, not just mode of transport.
Common misconception
“Electric vehicles are unambiguously zero-emission, full stop, since they don't have a tailpipe.”
Zero tailpipe emissions is accurate but incomplete. A full well-to-wheel comparison includes the emissions from generating the electricity used to charge the vehicle, which varies substantially depending on the local grid's fuel mix — an EV charged on a coal-heavy grid has a meaningfully different real-world footprint than one charged on a low-carbon grid, even though both are equally "zero-emission" at the tailpipe.
Quick check
Why is 'emissions per passenger-mile' considered a fairer way to compare transportation modes than comparing raw per-vehicle emissions?
Try it yourself
Estimate per-passenger emissions for a trip
Estimated emissions per passenger (kg CO2)0.88
What to do next
What to do next
When comparing transportation options, think in emissions per passenger-mile, not just per-vehicle numbers.
Carpool or take transit for routes where realistic ridership is reasonably high — the per-passenger benefit depends on actual occupancy, not the mode alone.
If considering an EV, check your local grid's fuel mix to understand its real well-to-wheel benefit, not just its zero-tailpipe claim.
Use the calculator above with your own trip's emissions and typical passenger count to see the occupancy effect directly.
FAQ
FAQ
Related terms
Related terms
Passenger-mile
A unit representing one passenger transported one mile, used to compare transportation modes fairly by accounting for how many people share a trip's emissions, not just the vehicle's total emissions.
Tailpipe emissions
Greenhouse gases released directly from a vehicle's exhaust while it's being driven, as distinct from emissions produced earlier in manufacturing the vehicle or generating the electricity/fuel it uses.
Well-to-wheel emissions
A fuller accounting of a vehicle's emissions that includes not just tailpipe output but also the emissions from producing and delivering its fuel or electricity, used to compare fuel types more completely.
This entry was researched from public sources and drafted with AI-assisted tools, then edited — errors are still possible. Spot one, or want a topic covered? Read our disclaimer.
 KnowThis