A census is an official, periodic count of a country's population, typically conducted every 5 or 10 years, whose results directly shape how many legislative seats each region gets, how electoral districts are drawn, and how much government funding flows to different areas based on population.
Reading time
— 4 min
Updated
— Oct 10, 2026
Fact-reviewed
— Aug 21, 2026
Key Takeaways
Key Takeaways
1A census is an official population count, typically conducted every 5 or 10 years, that goes well beyond satisfying curiosity — its results directly shape political representation and funding.
2Census counts drive apportionment, the process of allocating a fixed number of legislative seats among regions based on population, so a region's political weight can literally shift after each new census.
3Government funding formulas in many countries are tied to census-derived population figures, meaning an undercount in a specific area can mean that area receives less funding than its true population would justify.
The concept
A census is a government's official count of everyone living in the country, usually done on a fixed schedule like once every 10 years. It's not just a number for statistics reports — many countries use the census results to decide how many representatives each region gets in the legislature and how public money gets divided up among different areas.
The reason census accuracy gets taken so seriously in most democracies isn't bureaucratic thoroughness for its own sake — it's that the resulting numbers feed directly into decisions about political power and public money.
Quick check
Is a national census mainly conducted to satisfy general curiosity about population statistics?
Worked examples
Example 1: How a census count feeds into density figures (baseline case)
A census counts 5,200,000 people living in a region covering 41,600 square kilometers of land. Dividing the population by the land area (5,200,000 ÷ 41,600) gives a population density of about 125 people per square kilometer — a single, useful comparative figure that only exists because the census provided a reliable population count in the first place.
Example 2: A region gaining seats after a census (edge case / variation)
Between two census counts, one region grows substantially faster than the national average, while another region's population stays flat. When seats are reapportioned using the new census figures, the faster-growing region gains one or more legislative seats, and the slower-growing (or shrinking) region loses seats to keep the total number of seats fixed — a real shift in political representation driven entirely by the updated headcount, not by any change in law or voting behavior.
Example 3: Why undercounts have lasting consequences (real-world / applied case)
If a specific community is undercounted in a census — commonly a risk for hard-to-reach populations, recent movers, or groups wary of engaging with government data collection — that community's official population figure comes in lower than its true size. Since apportionment and many funding formulas run directly off the census number, that undercounted community can end up with less political representation and less funding than its actual population would justify, for the entire multi-year period until the next census is conducted.
Quick check
If a community is undercounted in a census, when does that undercount typically get corrected?
How it works (visual)
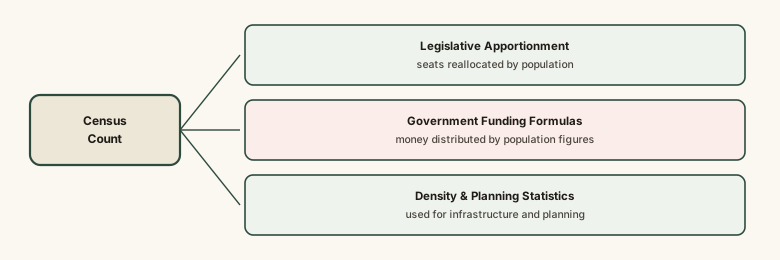
From census count to real-world consequences
The single census count at the top of the diagram is doing a lot of downstream work — representation, funding, and planning all commonly trace back to that one number.
Common mistakes
Common Mistakes
✕
Assuming a census is just a background statistics exercise with no direct personal or political stakes.
→ Remember census figures commonly drive real apportionment and funding decisions, which is why full and accurate participation matters.
✕
Assuming census population figures update continuously between census cycles.
→ Check when the most recent census was conducted — the population figure used for official purposes typically stays fixed until the next scheduled count.
✕
Treating a census as identical across every country in scope and frequency.
→ Verify the specific country's own census schedule and what data it collects — both vary meaningfully around the world.
Common misconception
“Census data collection is purely for historical record-keeping and academic research, with no bearing on real political power or money.”
In most democracies that conduct a regular census, the resulting population figures directly drive legislative apportionment (how many seats each region gets) and commonly feed government funding formulas as well. A census undercount in a specific community translates into real, multi-year consequences for that community's representation and funding — not just an inaccurate historical record.
Quick check
Does apportionment (allocating legislative seats by population) happen once and then stay fixed forever?
Try it yourself
Calculate population density from a census count
Population density (people per km²)125
What to do next
What to do next
Look up when your own country's most recent census was conducted and what data it collected, on that country's official statistics agency site.
If you want to see apportionment in action, compare a region's legislative seat count before and after its most recent census.
Next time you see a population density figure reported, remember it traces back to a census count divided by a land area — the same simple calculation used above.
If your country has an upcoming census, consider that full participation directly affects your own region's future representation and funding.
FAQ
FAQ
Related terms
Related terms
Census
An official, periodic count of a country's population conducted by a government, typically collecting basic demographic data alongside the headcount itself.
Apportionment
The process of allocating a fixed number of legislative seats among regions based on their population, most commonly recalculated using each new census count.
Population density
A measure of how many people live per unit of land area (such as per square kilometer), calculated by dividing total population by land area.
Undercount
When a census systematically misses counting some portion of the population, often concentrated in specific hard-to-reach or historically undercounted groups, which can skew apportionment and funding decisions.
This entry was researched from public sources and drafted with AI-assisted tools, then edited — errors are still possible. Spot one, or want a topic covered? Read our disclaimer.
 KnowThis