 KnowThis
Key Takeaways
Key Takeaways
- 1Global mean sea level has risen roughly 21-24 cm (about 8-9 inches) since 1880, and the rate of rise has accelerated in recent decades, per NASA and NOAA satellite and tide-gauge records.
- 2Two mechanisms drive most of the rise: thermal expansion (warmer water simply takes up more volume) and melting land ice from glaciers and the Greenland and Antarctic ice sheets.
- 3Sea level rise is not uniform — local factors like land subsidence, post-glacial rebound, and regional ocean currents mean some coastlines are experiencing faster relative rise than the global average, while a few are effectively seeing sea level fall.
The concept
That distinction between global average rise and what a specific coastline actually experiences turns out to matter enormously — the same amount of global sea level rise can mean very different things depending on where you live.
Which best describes the two main causes of global sea level rise?
Worked examples
Example 1: Projecting sea level rise over a set number of years (baseline case)
Example 2: Why some coastlines are rising while others sink faster than average (edge case / variation)
Global sea level is rising overall, yet tide gauges in parts of Sweden show local sea level actually falling. What explains this?
Example 3: The Netherlands' engineered response to rising water (real-world / applied case)
Roughly 26% of the Netherlands sits below sea level, and the country has spent centuries managing the ongoing risk this creates, most notably after a catastrophic North Sea flood in 1953 killed over 1,800 people and prompted the construction of the Delta Works — a large-scale system of dams, sluices, storm surge barriers, and dykes designed to protect the country's low-lying coastline. As global sea level continues to rise, the Netherlands has continued reinforcing and adapting this system, treating coastal defense as continuous infrastructure rather than a finished project — a direct, engineered response to the same physical process (rising water levels against a fixed, low-lying coastline) discussed throughout this entry.
How it works (visual)
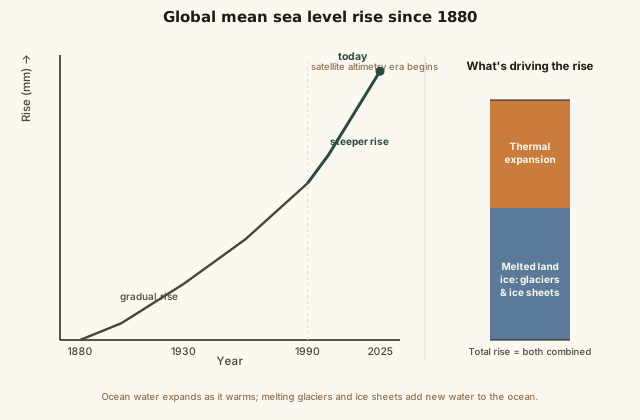
Notice the line's slope isn't constant — it visibly steepens after the early 1990s, when satellite altimetry became the primary measurement method and detected an accelerating rate of rise compared to the earlier tide-gauge-only era. The two stacked contributing factors on the side panel show that neither thermal expansion nor land ice melt alone explains the full picture; both are actively contributing at the same time.
Common mistakes
Common Mistakes
Assuming melting sea ice (like Arctic ice floating on the ocean) directly raises sea level.
→ Floating sea ice is already displacing its own weight in water, so its melting adds essentially nothing to sea level. Sea level rise instead comes from land ice (glaciers, Greenland, Antarctica) melting and adding new water, plus thermal expansion.
Treating global average sea level rise as the number every coastline will experience.
→ Local factors — land subsidence, post-glacial rebound, regional currents — can make a specific coastline's relative sea level rise faster or slower than the global average, or even fall in some rare cases.
Assuming sea level rise has been happening at a constant, unchanging rate.
→ Satellite records since the early 1990s show the rate of global sea level rise has been accelerating compared to the 20th-century average, not holding steady.
Common misconception
“Sea level rise is uniform everywhere on Earth — a certain number of millimeters per year applies equally to every coastline.”
The commonly cited global average rate (currently in the range of 3-4+ mm per year, per NASA and NOAA satellite data) is a planet-wide average, not a value that applies evenly everywhere. Regional ocean currents and wind patterns cause warm water — and therefore higher sea levels from thermal expansion — to pile up more in some ocean basins than others. Meanwhile, what actually happens to a given coastline depends just as much on what the land itself is doing: places experiencing subsidence, like parts of the U.S. Gulf Coast or the sinking city of Jakarta, see relative sea level rise well above the global average, while places still undergoing post-glacial rebound, like parts of Scandinavia, can see local relative sea level hold steady or even fall. The same global process produces very different local outcomes.
Two coastal cities are both affected by the same amount of global sea level rise, but one is flooding far more frequently than the other. What is the most likely explanation, beyond the ocean itself?
Try it yourself
What to do next
What to do next
- Try the calculator above with a higher rate, like 4.5 mm/year, and a longer horizon, like 75 years, to see how the projection compounds over time.
- Next time you read about a specific city's flood risk, check whether the article mentions local land subsidence — that factor often matters more than the global average alone.
- Look up your own region's tide gauge trend on NOAA's Sea Level Trends tool to see whether your local coastline is rising faster or slower than the global average.
- Read the related entry on Coral Reefs & Marine Geography to see how the same warming ocean affects reef ecosystems.