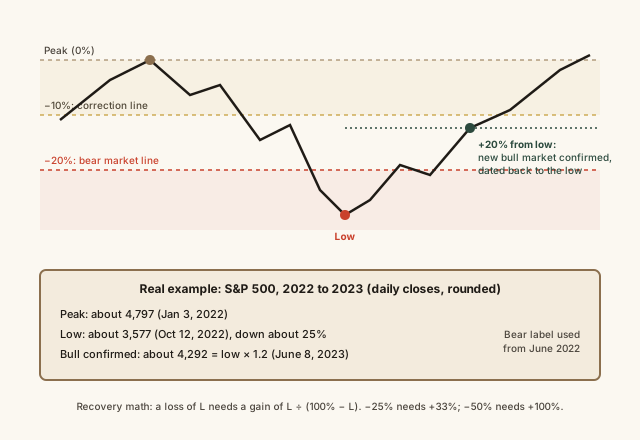
Bull and bear markets are labels for the direction and size of a broad market move. By the convention FINRA describes, a bear market is a decline of 20% or more in a broad index such as the S&P 500 from its recent high, a correction is a decline of at least 10%, and a bull market is a rise of 20% or more from a low. No regulator or exchange declares them; financial media and analysts apply the threshold after the fact, measured on closing prices. Real examples show the range: the S&P 500 fell about 57% from October 2007 to March 2009, about 34% in just over a month in early 2020, and about 25% across most of 2022, after which a new bull market was dated from the October 2022 low once the index closed 20% above it in June 2023. Because the labels are applied in hindsight, they describe what already happened rather than predicting what comes next. Losses also need larger percentage gains to recover: a 50% fall requires a 100% rise to get back to even.
Reading time
— 5 min
Updated
— Sep 30, 2026
Fact-reviewed
— Sep 30, 2026
This entry explains what market labels mean and how they're measured, not personalized investment advice. Past market moves don't predict future ones, and investing involves risk, including loss of principal. For decisions about your own money, consult a licensed financial professional.
Key Takeaways
Key Takeaways
1A bear market is a fall of 20% or more from a recent high in a broad index. A bull market is a rise of 20% or more from a low. A correction is a fall of at least 10%.
2These are conventions, not official rulings. Nobody declares them, and they're confirmed only after the move has happened.
3Losses need bigger percentage gains to recover: a 25% fall needs a 33% gain, and a 50% fall needs a 100% gain.
The concept
"Bull" and "bear" are just shorthand for big moves up and big moves down. The usual story is that a bull thrusts its horns upward and a bear swipes its paws downward. The working definitions are simple percentages. If a broad index like the S&P 500 falls 20% or more from its most recent high, people call it a bear market. If it rises 20% or more from a low, that's a bull market. A fall of 10% to 20% is called a correction. The catch is that you only know which one you're in after the fact. On the day the market hits bottom, nobody knows it's the bottom. It only becomes "the low" once prices have climbed well away from it.
Quick check
The S&P 500 is 14% below its record high. Which label fits by the usual convention?
Worked examples
Example 1: The 2022 bear market (baseline case)
The S&P 500 closed at about 4,797 on January 3, 2022. As inflation rose and the Federal Reserve raised interest rates, it slid to about 3,577 by October 12, 2022. The drawdown: (4,797 − 3,577) ÷ 4,797 ≈ 25.4%. It crossed the 20% line in June 2022, which is when headlines started saying "bear market," though by then most of the fall had already happened. For a new bull market, the index needed a close 20% above the low: 3,577 × 1.2 ≈ 4,292. It got there on June 8, 2023, eight months after the bottom.
Example 2: Fast and slow bears (edge case)
Bear markets differ enormously in speed and depth. In 2020 the S&P 500 fell from about 3,386 on February 19 to about 2,237 on March 23, a drop of roughly 34% in just over a month, and it was back at a record high by August 2020. The 2007 to 2009 bear market ran from about 1,565 in October 2007 to about 677 in March 2009, roughly 57% over 17 months, and the index took more than four years to regain its 2007 high. Same label, very different experience. The label tells you the size of the fall that already happened, nothing about how long recovery will take.
Example 3: Why recovery takes a bigger percentage (applied)
Say $10,000 sits in a broad index fund. A 25% bear market cuts it to $7,500. To get back to $10,000, it needs to gain $2,500 on a $7,500 base, which is 33%, not 25%. A 50% fall turns $10,000 into $5,000, and getting back needs a 100% gain. This arithmetic is why the depth of a fall matters so much, and why rebounds off a bottom look so large in percentage terms. It works the same way as compounding: every percentage applies to whatever balance you have at that moment. It's also why, according to the SEC's Investor.gov, matching how much you hold in stocks to your time horizon and tolerance for losses matters before a bear market arrives, not during one.
Quick check
Your investment falls 40%. What gain do you need to break even?
How it works (visual)
How bull, bear and correction labels are measured
Common mistakes
Common Mistakes
✕
Treating the bear-market headline as a signal to sell.
→ By the time the 20% line is crossed, much of the fall has usually happened already. The label describes the past. Decisions belong to your plan, time horizon and risk tolerance.
✕
Assuming a 30% loss needs a 30% gain to recover.
→ It needs about 43%. Work from the smaller balance: loss ÷ (100% − loss).
✕
Using 'bear market' and 'recession' interchangeably.
→ One is a fall in stock prices, the other a broad decline in economic activity dated by the NBER. They often overlap, but not always: 2022 had a bear market without an NBER-dated recession.
Common misconception
“Someone officially announces when a bull or bear market begins.”
No regulator, exchange or central bank declares them. The 20% threshold is a convention, and the start of a bull market is dated backward to the low only once prices have risen 20% from it. That's why you'll often see a new bull market "begin" months before anyone called it one.
What to do next
What to do next
Check which index a headline is measuring (S&P 500, Nasdaq, Dow) and whether the figure is from closing or intraday prices.
Calculate the gain needed to recover from any loss with: loss ÷ (100% − loss).
Read Investor.gov's guide to asset allocation and rebalancing before markets fall, not during a decline.
If a market drop is pushing you toward a big decision, talk it through with a licensed financial professional first.
FAQ
FAQ
Related terms
Related terms
Bear market
A decline of 20% or more in a broad market index from its most recent high, by common market convention.
Bull market
A rise of 20% or more in a broad market index from its most recent low, by common market convention.
Market correction
A decline of at least 10% (but less than 20%) from a recent high, often followed by a resumption of the earlier trend.
Drawdown
The percentage fall from a peak value to the lowest point that follows, before a new peak is reached.
Market circuit breaker
An exchange rule that pauses trading market-wide after large single-day falls in the S&P 500: 15-minute halts at 7% and 13% (if triggered before 3:25 p.m. Eastern), and a halt for the rest of the day at 20%.
This entry was researched from public sources and drafted with AI-assisted tools, then edited — errors are still possible. Spot one, or want a topic covered? Read our disclaimer.
 KnowThis